When I made the decision to start blogging or giving directions and tips regarding some of the open source tools I use every day, I did so with some of my favourite projects in mind. For anyone who knows me, they would expect software like FreeBSD and PostgreSQL, products a lot of us use every day without realising it, but I had one in mind above the rest - an enterprise-grade log aggregator called ELSA.
ELSA, short for Enterprise Log Search and Archive, is a log aggregator and search tool built on a collection of utilities common to most Unix and Linux system administrators: syslog-ng, MySQL, Sphinx, Apache and perl. The project page can be found here.
To say that it's useful is an understatement. In a professional capacity I have probably fifty servers and a couple of hundred switches, routers and appliances logging to ELSA nodes. If it speaks syslog, ELSA can take it. So what sets ELSA apart from all of the other utilities? Why should anyone use ELSA instead of, say, plain syslog? Why not GrayLog2? Why not go commercial and buy Splunk?
First, let me say that those are fantastic products. Syslog is the standard for logging in the Unix world. I used GrayLog2 for a couple of months when I started looking at syslog alternatives and it rocked until it hit relatively high load. The graphs and the user interface are sleek and can make managers drool. Once I started pushing more than about 1k events/second, though, Java started falling down and services started crashing. Not cool. I thought about really digging in and tweaking the devil out of it but I'd have had to learn the intricacies of both MongoDB and ElasticSearch and, at the time, I didn't have the time to devote to learning a bunch of new products. I wanted something based on tried and tested Unix tools that any Unix SA could come behind me and help troubleshoot if something went wrong.
I demo'd Splunk and I have absolutely nothing bad to say about the product. There are connectors for all sorts of devices and operating systems, it uses a multi-node indexing and querying configuration so you can have any <n> number of aggregators with any <n> number of query servers. This lets you add log collectors as your infrastructure requires and allows and, because they charge per GB you index, you can literally throw as many machines into that role as you need without affecting your licence.
That's the rub, though. Splunk is an awesome product but it carries an awesome price tag. My unit alone generates some 15 - 25 GB of data per day, depending on load, and I want to be able to search *all* of it from one place. My division generates two to three times that. Care to guess what a 50GB or 100 GB/day licence from Splunk costs?
Then I stumbled upon ELSA. The installation looked simple, the author provides a single script that you run and it takes care of everything. Maintenance looked fairly simple, it uses syslog, MySQL, Apache, perl and Sphinx, and I'm already intimately acquainted with four of those five tools. It could run on FreeBSD, yet another plus. The licence was acceptable (I prefer BSD but the GPLv2 works). It supports AD/LDAP and local database authentication with a robust permissions system. I got approval from my boss and started tossing hardware at it.
Like Splunk, ELSA uses a very distributed model. Each server forwards their logs via syslog to an ELSA node. You can setup any number of ELSA nodes.
As well as having any <n> number of nodes, you can have any <n> number of web front-ends, and each front-end can query any <n> number of nodes. Selecting which nodes you query with the front-end is handled through a configuration file on the front-end but the node has to be configured to allow those queries. This means you can have separate ELSA nodes for networking equipment, web servers, database servers, your ERP, AD/LDAP or any other departmental use and each department can have their own front-end that queries just their nodes -- but InfoSec can have a "master" front-end that can query *every* node.
Did I mention ELSA is my favourite open-source project at the moment?
So how complex is it to setup and start using? Well well well, let's go to our trusty virtualisation environment and start working!
EDIT** Please note that the following instructions are now out-dated; updated instructions can be found at http://opensecgeek.blogspot.com/2013/07/enterprise-logging-with-elsa.html
There was some conversation on the ELSA users mailing list recently about problems with Debian 6 and the web front-end which the author, Martin, quickly addressed. To give him another datapoint I opted to run a node and the web front-end (hereafter referred to as the WFE) on Debian 6.
VM Setup
As always, I opted for a minimal installation and cloned it rather than doing two completely separate installations. Following my previous naming scheme I named them "Debian_6_i386_121" and "Debian_6_i386_122":


ELSA Installation
After they were finished installing I went ahead and installed the server packages for OpenSSH and MySQL with
sudo apt-get install mysql-server openssh-server
To keep things simple I left the password for the MySQL "root" account empty. On a production deployment I would set it and then add a /etc/elsa_vars.sh file where I could put it for the ELSA installation but for this purpose, blank works just fine.
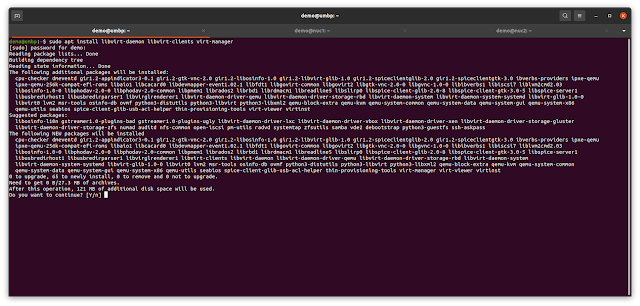
The ELSA node installation is two commands:
wget "http://enterprise-log-search-and-archive.googlecode.com/svn/trunk/elsa/contrib/install.sh"
sudo sh -c "sh install.sh node"
On the vm hosting the WFE, it's almost identical:
wget "http://enterprise-log-search-and-archive.googlecode.com/svn/trunk/elsa/contrib/install.sh"
sudo sh -c "sh install.sh web"
With both of those running, I stepped back for about thirty minutes. My Macbook is peppy but those are some bandwidth intensive installations and my DSL connection is most decidedly NOT peppy.

And on the WFE:

Testing
Since I have a host of virtual machines already on the psql_test network, I went ahead and cranked up all three FreeBSD machines (from the PostgreSQL replication/DNS posts) and my KUbuntu VM. On the FreeBSD machines I edited /etc/syslog.conf and, just past the comments sections, added a line that directed syslog to send anything it received to 10.10.10.121. To do that, use:
*.* @10.10.10.121
To see that in the config file:

Then I restarted with:
sudo /etc/rc.d/syslogd restart
I then did that on FBSD_8_3_i386_103 and FBSD_8_3_i386_104, so now all three virtual machines are sending all of their syslog data to 10.10.10.121.
So that I could query the node from the WFE, I edited /etc/elsa_web.conf on the VM hosting the WFE, Debian_6_i386_122, and added the node information to the backend node section:

This was followed by an apache restart on the WFE:
sudo /etc/init.d/apache2 restart
Interrogating ELSA
Having a rocking syslog configuration does nothing if you can't get the information back out of it. Now that my BSD machines were sending their logs to it, I needed to query it so I logged in on my KUbuntu virtual machine, opened a browser and pointed it at the ELSA WFE at 10.10.10.122:

The first time I saw that I thought, "you have to be kidding me...that much work and that's what we're given?" So I started looking. We have 10.10.10.102 sending logs there, let's see if we can get anything out of it:

You can ignore the "Warning:" in red. By default the WFE looks for a local node installation (the same machine can be your node and WFE) and I didn't comment that out of the elsa_web.conf file, but whoa whoa, that looks useful! We just got everything that matched "10.10.10.102". What about if I look for "syslogd"?

Note I got back data from two separate hosts, and that the "host=<ip>" area is clickable. Clicking on that adds it to the query bar, so if I click on the first one and click "Submit Query", I get:

Did I mention that ELSA is currently my favourite open source project?!
Some more reading
After deploying it on real hardware I realised my early comments were completely ludicrous. The more I used it, and the more data I started throwing at it, the more I realised this tool was *incredible*. I started pointing all of my Windows (via SNARE), Linux (syslog, syslog-ng and rsyslog) and BSD (syslog, rsyslog) servers to it. I started pointing appliances, switches and routers at it and added a second node.
Once I started reading the author's blog at ossectools.blogspot.com I started to get a REAL look at what I could do with ELSA. I created a PostgreSQL and MySQL database and pointed ELSA at those as alternate datasources. I started investigating pushing my IDS logs at it and then combining attack data from the IDS alerts with data in the databases. It didn't take me long to realise Martin had written a log search and archival tool that was perfect for incident handlers and incident responders.
To wrap things up, I highly recommend giving this project a test drive. Martin has some great documentation, both at the official project page and at his blog, "Open-Source Security Tools", and the mailing list for the project is both highly supportive and very active.


No comments:
Post a Comment
Note: only a member of this blog may post a comment.